Evaluation of the Adhesion of a Transdermal Patch: Pros & Cons of Proposed Methods
Miguel Fortuny,Clinical Research Manager
The correct adhesion of a transdermal patch to skin throughout the established time of use is key to guarantee the effective administration of the dose declared in the prescribing information.
In this article we dive into the different methods to quantify the adhered percentage of a transdermal patch, analyzing the advantages and disadvantages of each one of them.
The importance of patch adherence
Patch adhesion is currently a regulatory requirement which involves a formal evaluation to grant the approval of a generic product.
As a consequence, there are international guidelines, mainly those issued by FDA and EMA, that have settled non-inferiority statistical criteria for patch adhesion as a requirement to be accomplished, besides the bioequivalence and sensitization/irritation demonstrations, in order to approve the regulatory package of a generic transdermal medicinal product.
FDA employs a scoring system to quantify patch adhesion (each one comprising ranges of percentages which are different in their span) and, as main indicator, compares the mean adhesion scores observed during the use of the products (Test and Reference). EMA, in turn, mainly considers the percentages of adhesion obtained throughout the use of the products and focuses into the last evaluation time of adhesion for the formal comparison.
To obtain the percentages of (from which the FDA can be obtained), guidelines recommend to use visual inspection- of trained observers- or the use of dot-matrix templates. This becomes an important defeat when the backing of the transdermal patch is opaque.
Given the condition required to accomplish the non-inferiority criteria on adhesion, and taking into account that the detachments of a transdermal patch during use are mainly irregular and can develop in several parts of the system, the use of templates with or without grid (matrix) seems to be more appropriate than the trained visual observation to obtain an adequate precision.
In this article we evaluate the pros and cons of two methods which have proved to be good in practice and that are being currently used to quantify the adhesion of generic patches during the clinical studies required for the regulatory filing of transdermal medicinal products. An alternative method proposing the use of photos and software is also mentioned.
Quantitative Methods to Evaluate Patch Adhesion
The analysis of two methods used to quantify the percentage of patch adhesion during use follows:
- Template with Grid and Ratio of Number of Squares:
It comprises the transcription of the detached zones of the patch to a transparent template having the exact shape of the patch, with a pre-printed grid, and obtaining the following ratio between the number of detached squares and the total number of squares of the grid:
% Adhesion= [(1 – (Sum of squares with detachments) / Total No. of squares] x 100%
According the guidelines which recommend this method, those detachments that involve partial areas of the grid squares should be accounted as if the detachment occupies those full squares. - Template without Grid and Ratio of Area Weights:
It comprises the transcription of the detached zones of the patch to a transparent template having the exact shape of the patch, taking a paper copy of the template, cut the shapes of detached areas and that of total patch area, and obtaining the following ratio between the weights of such areas:
% Adhesion= [1 – (Sum of Weights of detached areas / Total Patch Area Weight)] x 100%
Both of these methods that quantify patch adhesion are mainly affected by operator biases, and the one originated by the need of placing the template onto the applied patch, which could translate into a non-desired pressure over the patch and re-stick it, altering the evaluation in that way (most of transdermal patches use pressure sensitive adhesives in their formulations). Nonetheless, such biases should be compensated if a trained operator performs the evaluation of Test and Reference products in each treatment period of the study evaluating patch adhesion, exercising a gentle and careful placement of the template over the applied patch.
Generally speacking, the detachments of a transdermal system are irregular in shape and/or can appear in different zones of the patch. In this sense, the use of a grid to calculate the detached areas would not offer precision advantages in the measurement when compared to the method that uses weights ratio, this becoming more evident if the backing layer of the patch is opaque. In this latter case, an intensive training is required, including the observation of the patch from lateral angles and appropriate lighting conditions to maximize the precision during the transcription of detached areas onto the template.
Which are the Pros and Cons of these Methods?
Method 1: Template with Grid and Ratio of Number of Squares
Situation: A same area detached of the patch, in different zones of the grid pre-printed in the template. (The example below was magnified to better explain the bias).
Method: Count all squares that involve the transcribed detached shape and relate it to the total number of squares of the grid, to obtain the % of detachment, and by difference, the % of adhesion.
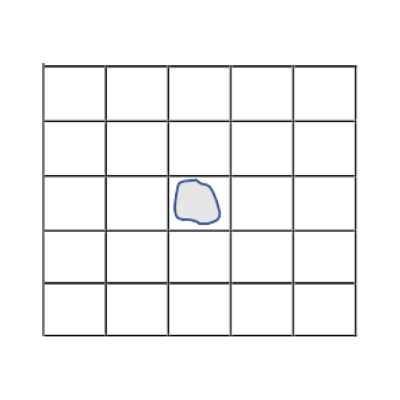
% Adhesion= [1 – (1/25)] x 100%
% Adhesion= 96%
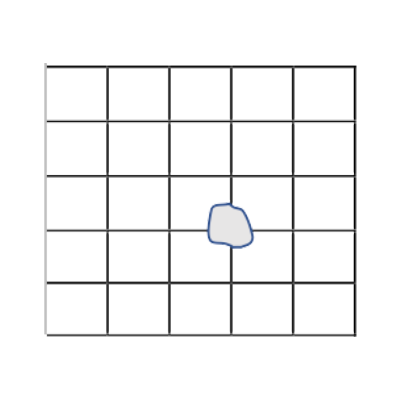
% Adhesion= [1 – (4/25)] x 100%
% Adhesion= 84%
Pros:
- It is mentioned as optional method in guidelines
- Does not require analytical balance to obtain the measurement
Cons:
- A same detached area, depending on where it appears in the grid and also on the quantity of squares of the grid, can yield to patch adhesion percentages significantly different using the ratio of square counts.
- It overestimates the % of detachment when it comprises partial areas of the squares of the grid.
- It requires a gentle placement of the template over the applied patch to transcribe the detached zones, to avoid/minimize the re-stuck of them onto the skin during such operation.
- The larger the number of squares of the grid, the higher the precision, but also the higher the risk of mistake from operator during count (the smaller the square, the lesser the perception whether it comprises or not the detachment).
- If the patches are of different size, the area of each square of the grid should be consequently adjusted to maintain the same precision during the evaluation. In other words, templates should differ in the quantity of squares in the grid.
- For patches having an opaque backing layer, a template with grid makes it harder to identify and transcribe the detached zones.
Method 2: Template without Grid and Ratio of Area Weights
Situation: The same area detached, in different zones of the template.
Method: Take the ratio between the weight of paper cuts from the detached patch zones and the weight of the paper cut of the total patch area, to obtain the % of detachment, and by difference, the % of adhesion.

% Adhesion= [1 – (0.012mg / 0.302mg)] x 100%
% Adhesion= 96%

% Adhesion= [1 – (0.011mg / 0.292mg)] x 100%
% Adhesion= 96%
Which are the advantages and disadvantages of this method?
Pros:
- For the same detached area, the obtained % of adhesion is almost identical in any part of the template.
- It has been used as an optional method in pivotal studies to quantify transdermal patch adhesion
- The variability from differences in paper homogeneity is negligible in a reduced area of the copy obtained from the template, to perform the evaluation.
- A template without a pre-printed grid allows a better identification and precision to transcribe detached areas from patches having an opaque backing layer.
Cons:
- It requires a gentle placement of the template over the applied patch to transcribe the detached zones, to avoid/minimize the re-stuck of them onto the skin during such operation.
- It relies on the operator precision to cut the shape of the detached zones, which is assumed to be similar while cutting the total area of the template (being the same operator). Bias is mainly compensated after taking the ratio of weights of the paper cut areas.
Alternative Method – Photos and Software
FDA y EMA guidelines recommend the obtention of photos of the patch application site as a complement of the adhesion evaluation at different times during the wearing period.
Having said that, and yet considering the existence of applications and software to obtain and process images with great precision, currently, there are no regulatory proposals to offer them as an alternative to the recommended quantitative methods to assess the adhesion of a transdermal patch.
The method using photos and further processing by software could be useful to quantitatively evaluate the difference in colour intensities between detached and well-adhered patch areas, and has the advantage that needs not to place a template over the patch for the adhesion evaluation; however, its application is limited in case of patches with opaque baking layers.
As an example, that is the case of both buprenorphine and rotigotine patches, in which the external layer is opaque and skin- or tan-coloured.
In the pictures below, one with a patch showing 100% adhesion (left) and the other with a patch with a significant detachment (right, 50% adhered), it is not possible to differentiate between them:
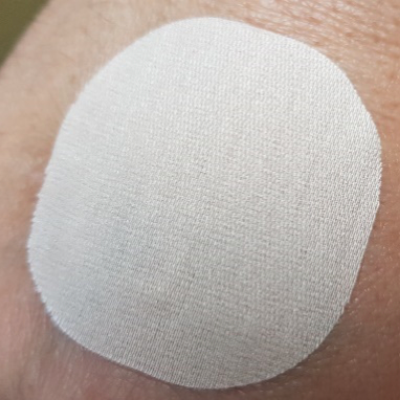
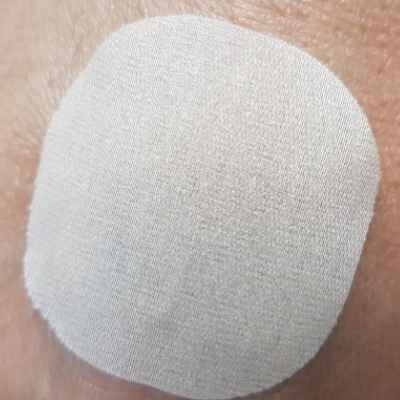
For these products with opaque backing layers, a photo does not offer the necessary precision to get the percentage of adhesion and a further formal comparison of this parameter.
Conclusions
The methods presently used to quantify the adhesion of a transdermal patch present some limitations, but they proved to be adequate and reliable in the field. Particularly, the method that uses ratio of weights, although more workable, seems to offer more precision than the one that employs the grid in the template, to be applied in a pivotal clinical study that evaluates the adhesion of a transdermal patch. The election of one or the other method will strongly depend on the regulatory context where the formal study is conducted.
The adhesion evaluation of a transdermal patch can be a relatively easy task if patches have transparent or translucent external layers, but it increases in complexity for patches with opaque backings.
The use of photos and their processing, as a tool to quantify transdermal patch adhesion, remains a subject of discussion in scientific forums and regulatory agencies, and is mainly oriented to standardize the experimental conditions for the measurement: distance to the object, resolution, illumination, counterfeit protection, techniques validation, and limitations related to product design, among others.
References
- Assessing Adhesion with Transdermal and Topical Delivery Systems for ANDAs. Guidance for Industry, Draft, CDER/FDA, Oct 2018
- Guideline on the Pharmacokinetic and Clinical Evaluation of Modified Release Dosage Forms, EMA/CHMP/EWP/280/96 Rev1, 20-Nov-14
- Public Consultation No. 760, 27-Dic-2019, ANVISA, Brazil
- https://www.agah.eu/wp-content/uploads/Schriever_patch_adhesion_local_tolerability.pdf
- https://www.sas.com/content/dam/SAS/support/en/sas-global-forum-proceedings/2020/4655-2020.pdf
Subscribe to
#AmarinNews
Partner with us!
We offer expertise and experience, together with flexibility and the ability to adapt to your needs.
- info@amarintech.com.ar
- +54 11 4588-6500
- Sanchez 2045 (C1416BQG), Buenos Aires, Argentina.